Clearer competency matrix, smoother process maps, and better KPI trends
This update makes three everyday work areas easier to read: the competency matrix, process maps, and KPI views. You get more context in one place, smoother map adjustments, and better support for reading trends over time.
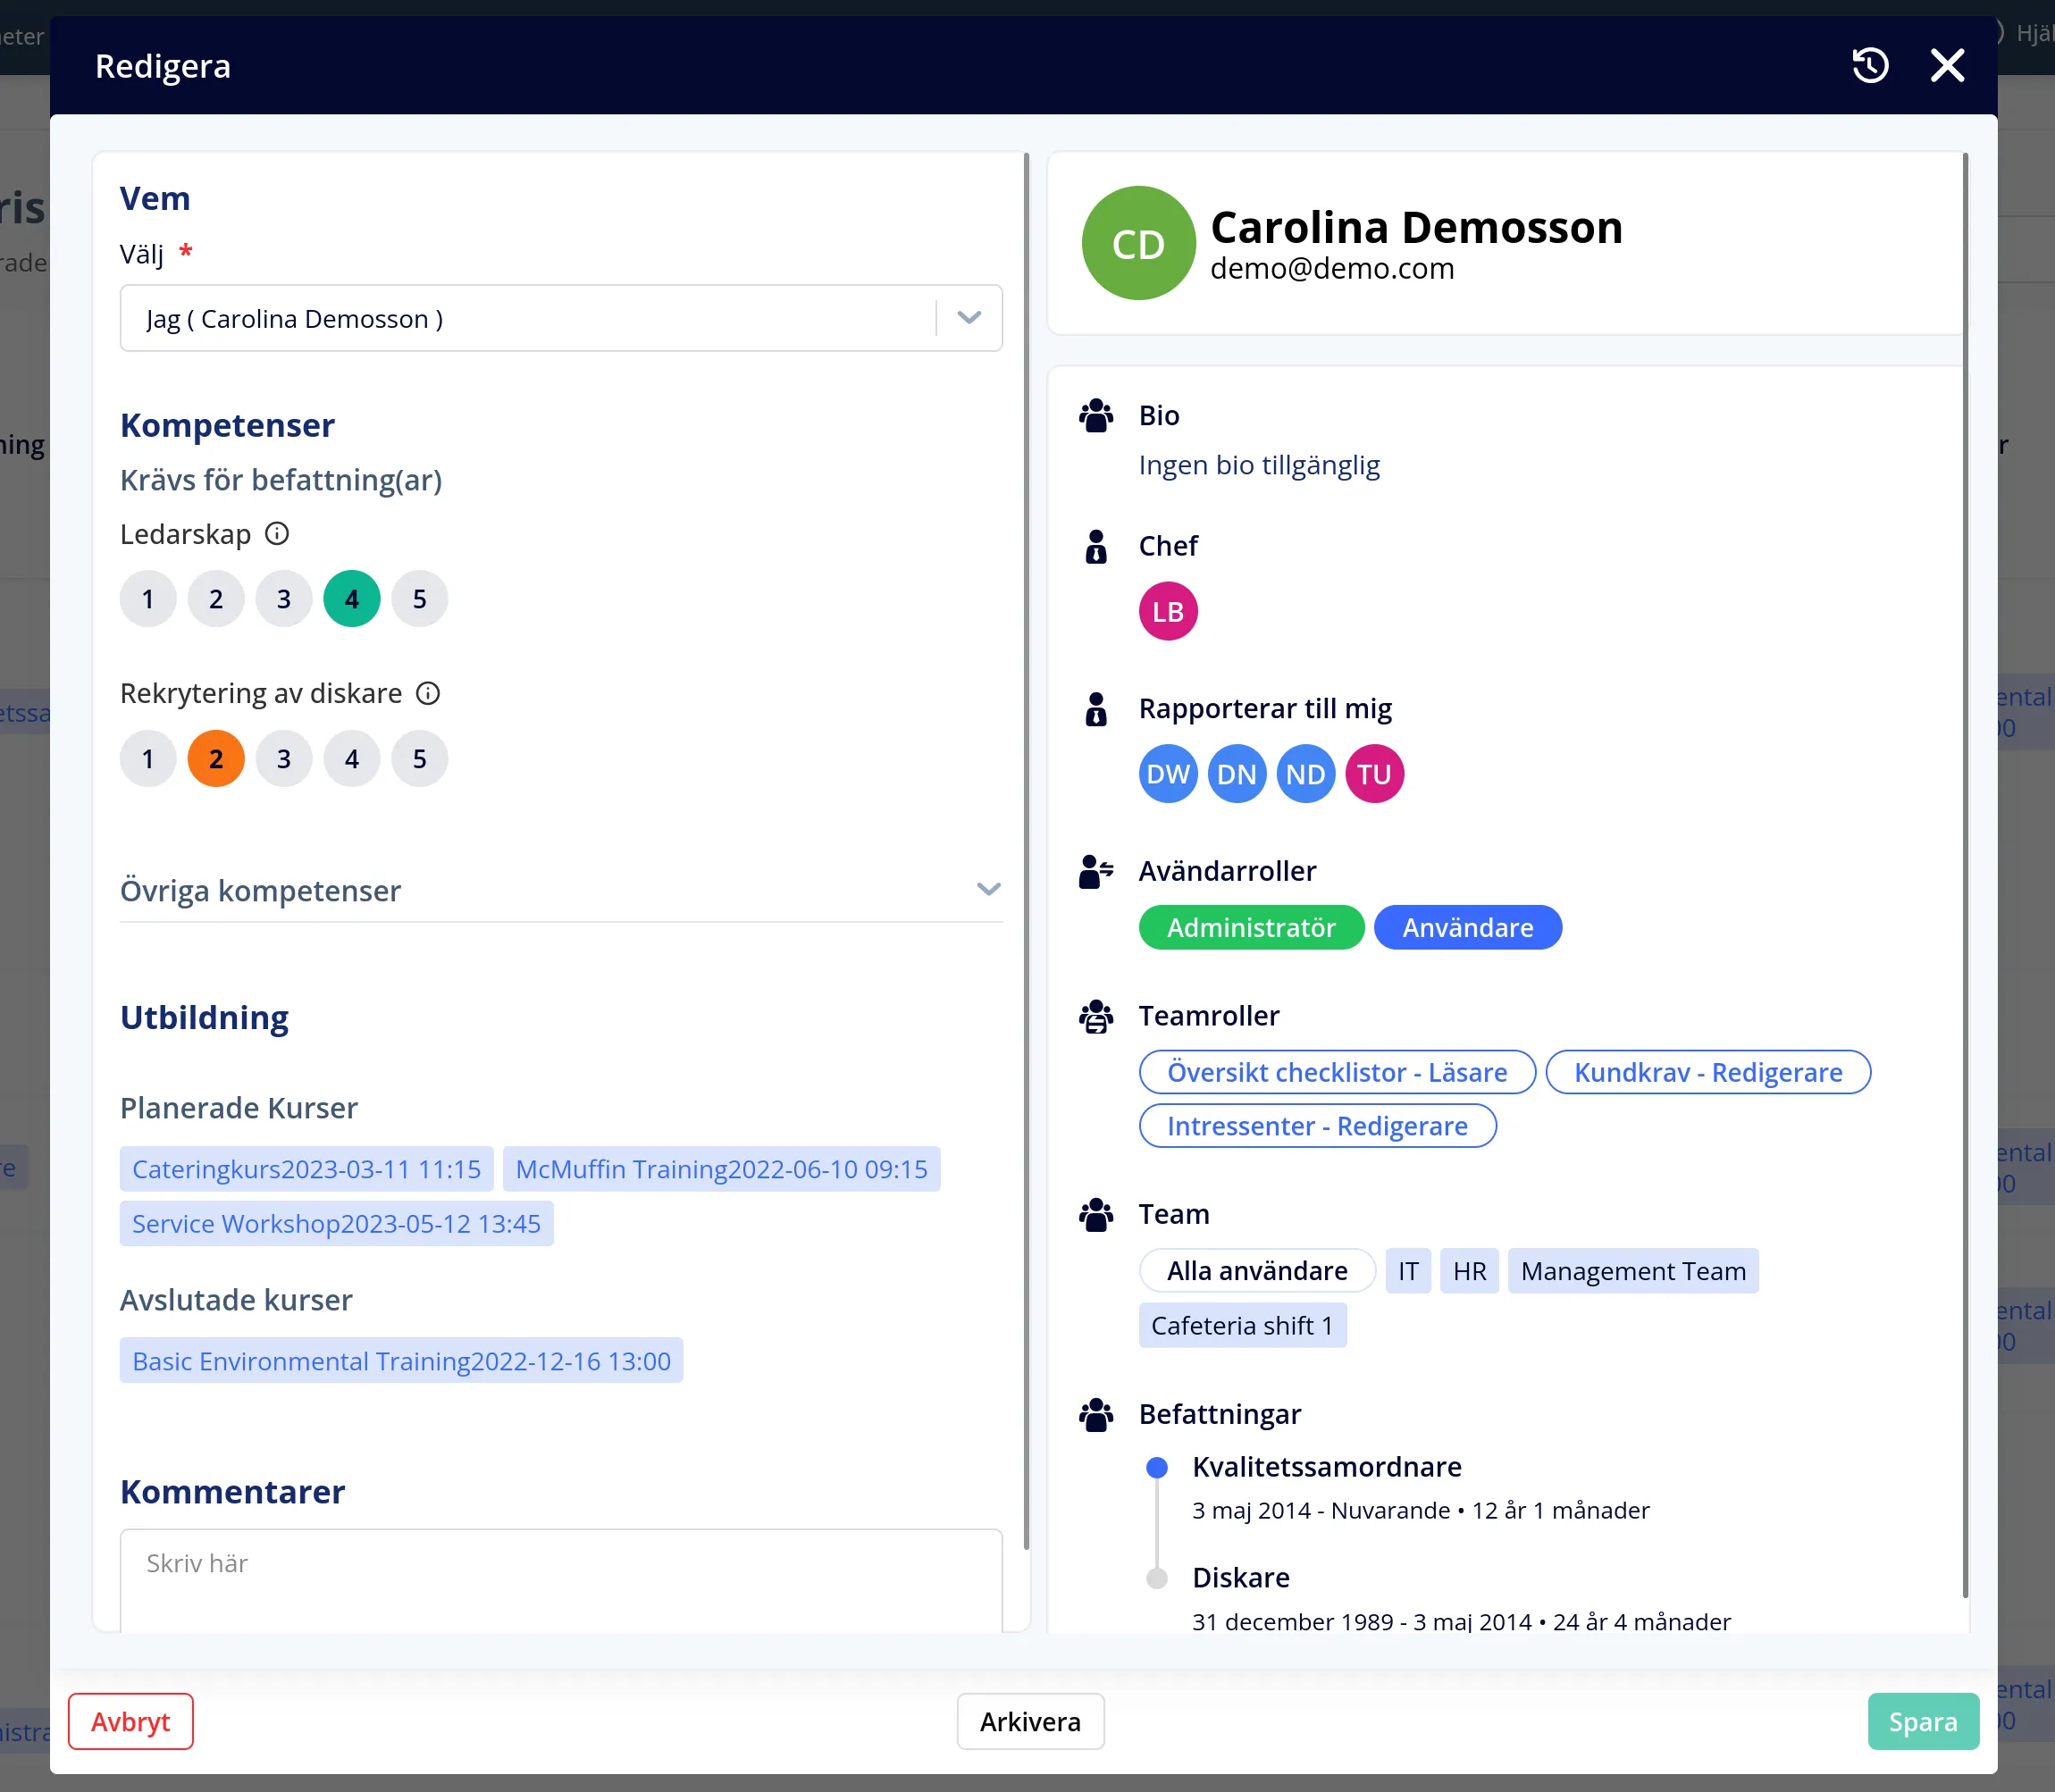
The competency matrix shows the right competencies first
When you choose a user in the competency matrix, the competencies tied to that person's current positions are now shown first. Other competencies can still be set, but they are hidden by default inside a collapsible section. The rating choices were also redesigned into clearer buttons, so it is faster to assess several competencies without losing the overview.
Process maps are easier to fine-tune
It is now easier to adjust how lines run between steps in a process map. When several subprocesses meet, you can move and fine-tune the connection more smoothly so the map stays readable.
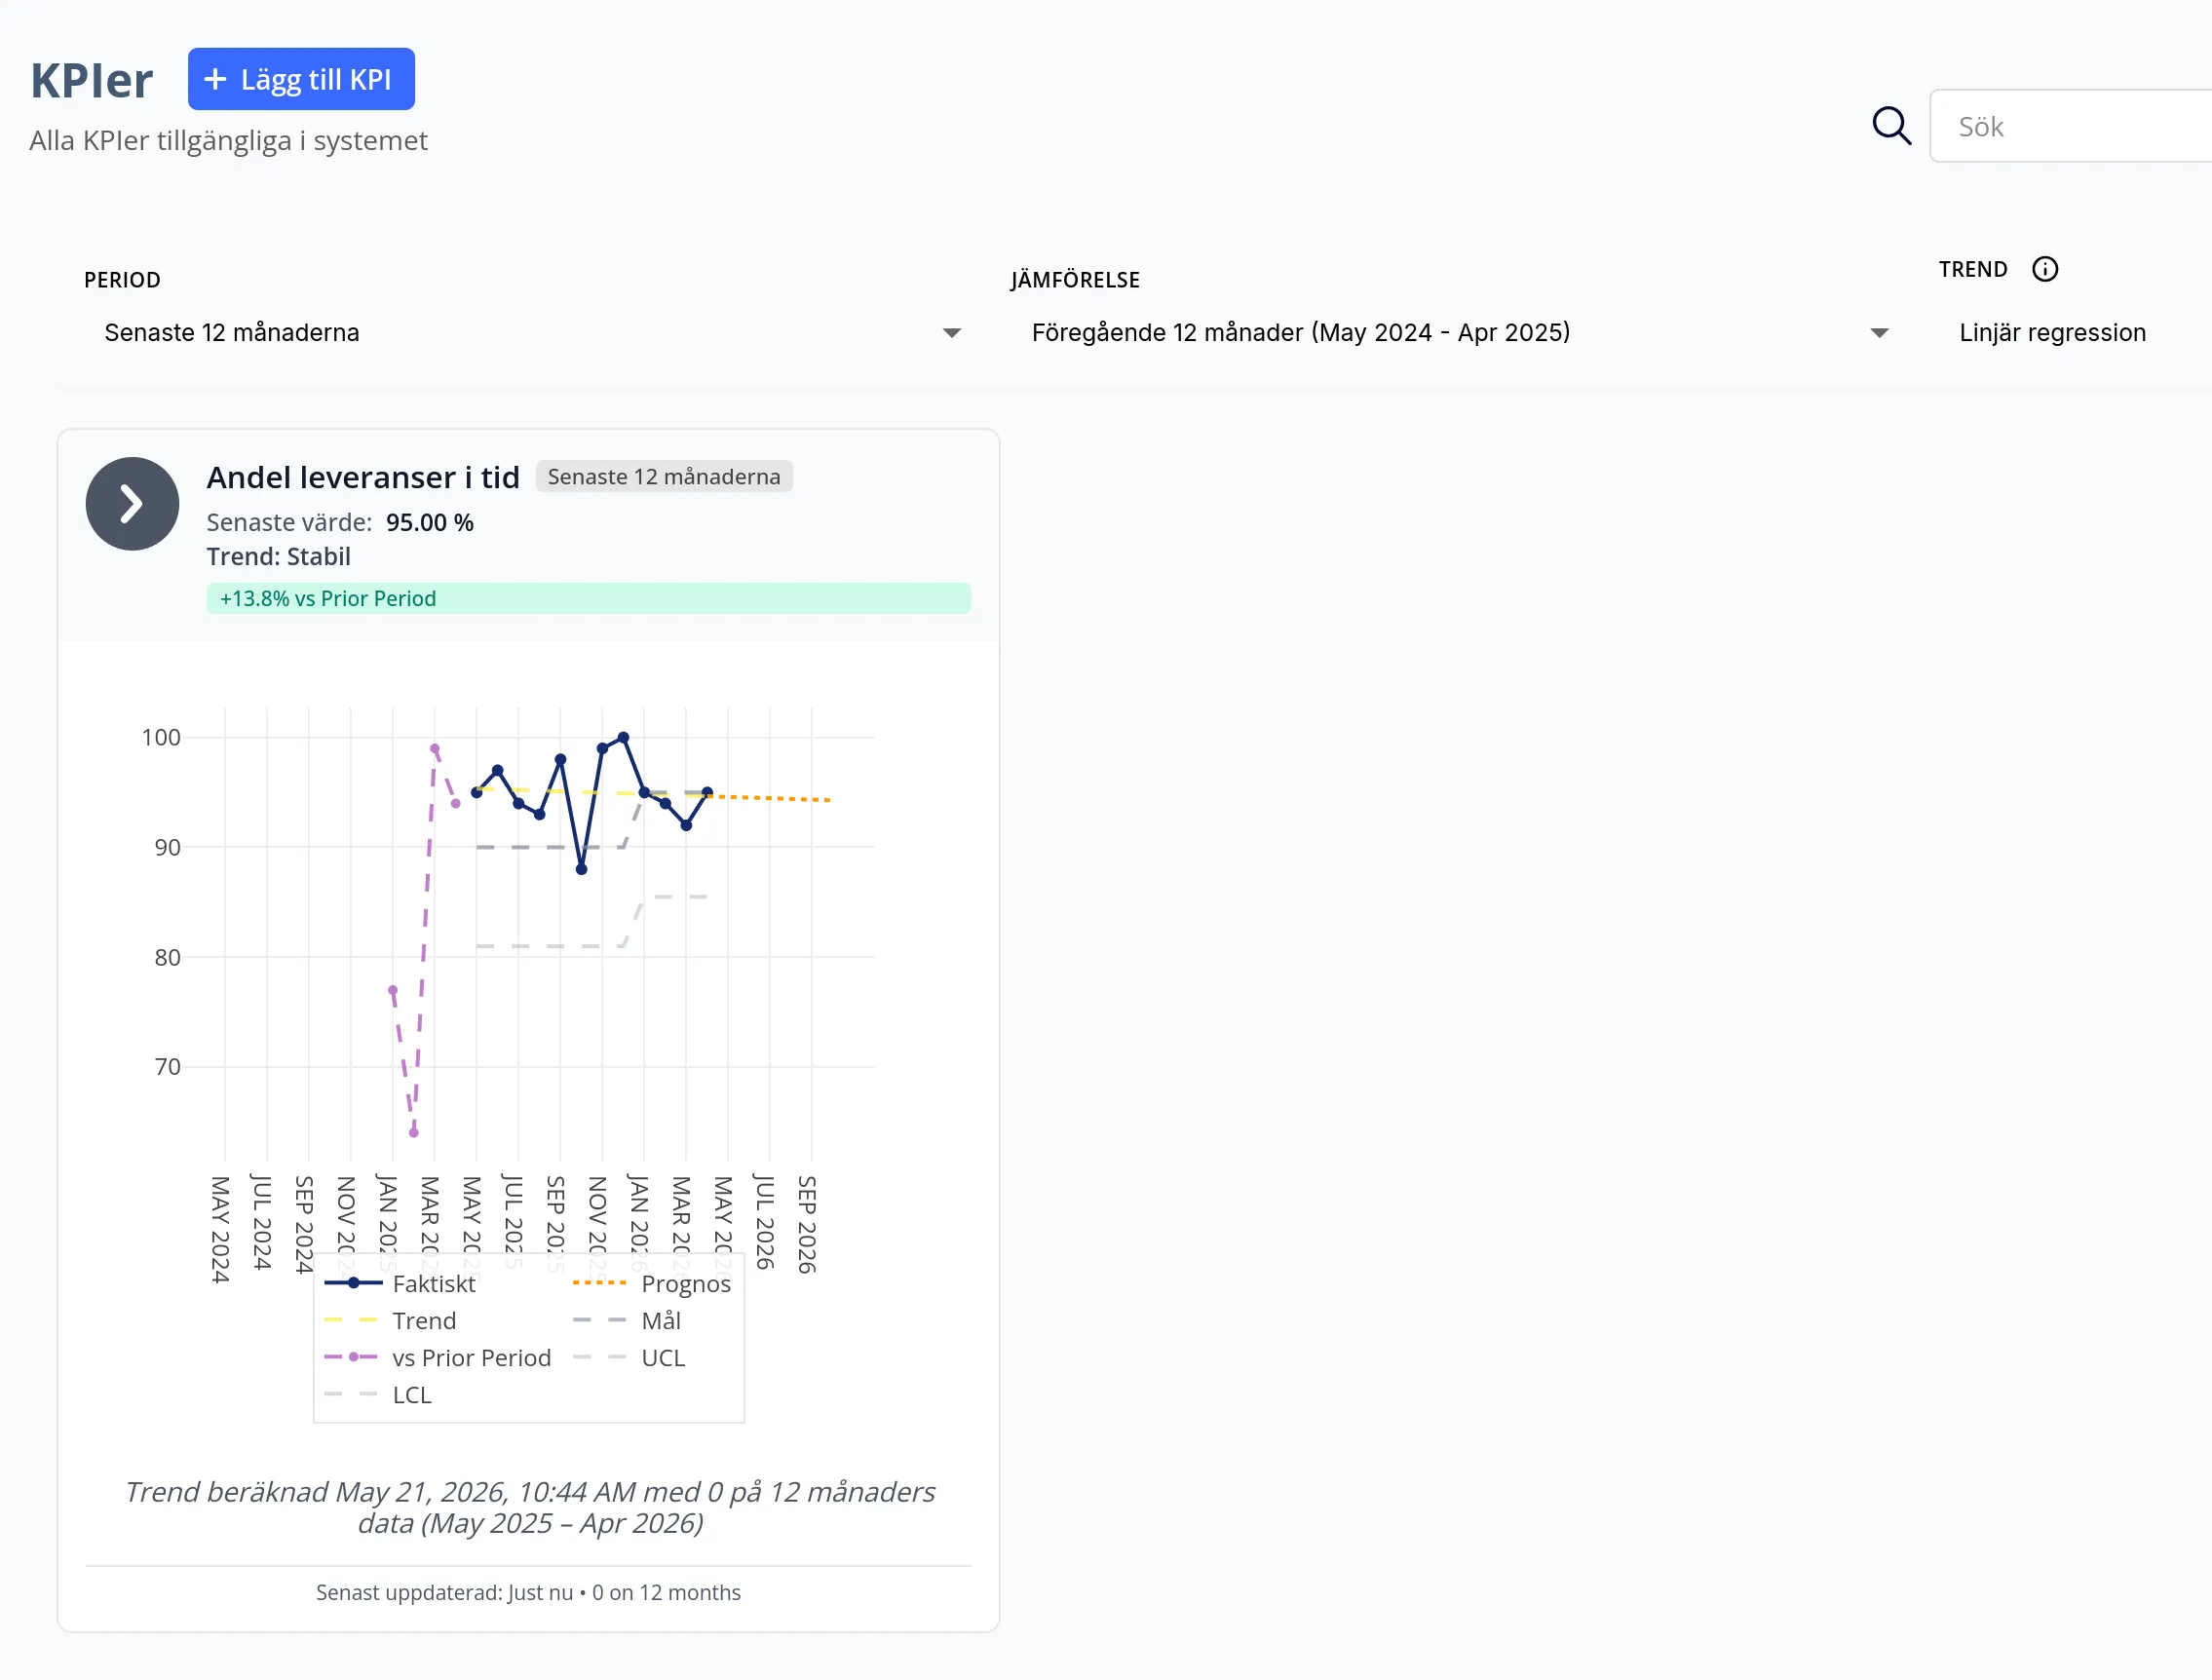
KPI trends show more of the story
The KPI view now shows more than the latest value. You can see the trend, forecast, and comparison against the previous period in the same chart. That makes it easier to explain whether a KPI is stable, moving in the right direction, or needs closer follow-up.
Have feedback on which KPI comparisons or process-map adjustments would help your team most? Contact support.
This page is also available in Swedish.